Configuring the Systems Center Monitoring Pack for Windows Azure Applications on SCOM 2012 Beta
•• Updated 9/7/2011 1:00 PM PDT with diagram and link to Daniele Muscetta’s blog and confirmation of no grooming operations 48 hours after (presumably) enabling.
• Updated 9/6/2011 9:45 AM PDT with the following status:
- Memory Available Megabytes collection rule is enabled as expected
- Total CPU Utilization Percentage collection rule isn’t enabled
- No evidence of grooming monitor data storage so far
See end of post for details.
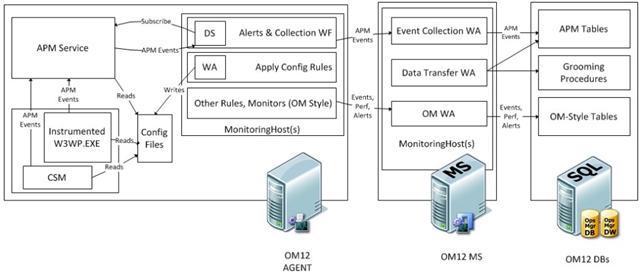
•• Following is a diagram of SCOM 2012’s Application Performance Monitoring architecture:
from Daniele Muscetta’s Application Monitoring Architecture in OpsMgr 2012 Beta post of 8/12/2011, which describes its capabilities and features.
The Systems Center Operations Manager team’s “Guide for System Center Monitoring Pack for Windows Azure Applications” documentation provides sketchy instructions for configuring the monitors you install for a service hosted by Windows Azure. (See my Installing the Systems Center Monitoring Pack for Windows Azure Applications on SCOM 2012 Beta post of 9/4/2011.)
This article is an illustrated tutorial for configuring performance monitoring and grooming Windows Azure Diagnostics data to prevent its storage requirements from costing large sums each month.
Inspecting Default Windows Azure Monitor Data
The “Key Monitoring Scenarios” section of the documentation says:
The following performance collection rules, which run every 5 minutes, collect performance data for each Windows Azure application that you discover:
- ASP.NET Applications Requests/sec (Azure)
- Network Interface Bytes Received/sec (Azure)
- Network Interface Bytes Sent/sec (Azure)
- Processor % Processor Time Total (Azure)
- LogicalDisk Free Megabytes (Azure)
- LogicalDisk % Free Space (Azure)
- Memory Available Megabytes (Azure)
However, the docs fail to mention until the last page that collecting Processor % Processor Time Total (Azure) and Memory Available Megabytes (Azure) data is disabled by default.
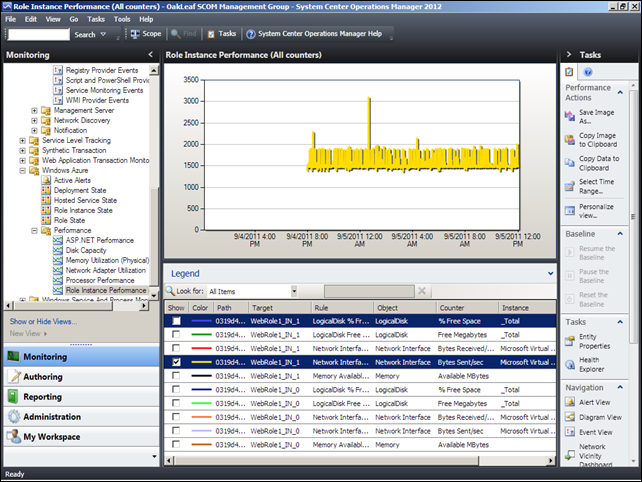
Clicking the Monitoring button and selecting the Monitoring \ Windows Azure \ Performance \ Role Instance Performance shows all available counters that are enabled by default. To display one or more counters, mark their check boxe(s):
This chart for Bytes/sec Sent by the second Web Role (WebRole1_IN_1) Network Interface represents the outbound network traffic (chargeable) starting about four hours after completing installation of the WAzMP at about 4:00 PM Sunday, 9/4/2011, through noon on Monday 9/5/2011.
Steady relatively steady-state bursts from 1,500 to about 1,800 bytes/sec probably represents monitoring traffic. The three pulses to about 2,300, 3,100 and 2,100 are likely to be from early risers in Europe.
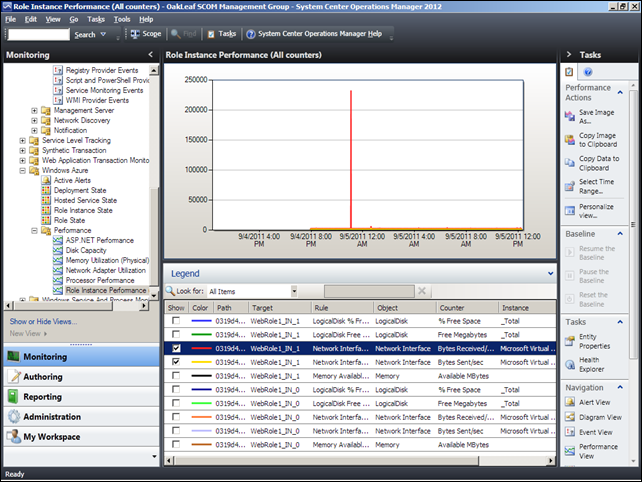
You can mark additional check boxes to overlay additional data, such as Bytes/sec Received (not chargeable). The 240 MB spike near midnight might be from a denial of service attempt.
Enabling Available MB of Memory and Total CPU Utilization Percentage Monitoring for a Windows Azure Role Instance (ServiceName)
The “Appendix: Rules and Monitors Disabled by Default” section at the end of the documentation states that several important features are disabled by default:
By default, the following rules are disabled in the Monitoring Pack for Windows Azure Applications:
- Windows Azure Role Performance Counter Grooming
- Windows Azure Role .NET Trace Grooming
- Windows Azure Role NT Event Log Grooming
By default, the following monitors are disabled in the Monitoring Pack for Windows Azure Applications:
- Memory Available MBytes Monitor
- Percent Processor Time Monitor
Enable these monitors to monitor processor and memory utilization. If you want Operations Manager to periodically groom data from Windows Azure Storage Services, enable the three grooming rules.
Note: The ServiceName value is oakleaf for these examples.
The following two sections describe how to enable these monitors. Later sections show you how to enabling grooming rules.
Making Windows Azure Monitors Visible in the Authoring \ Management Pack Objects \ Monitors List
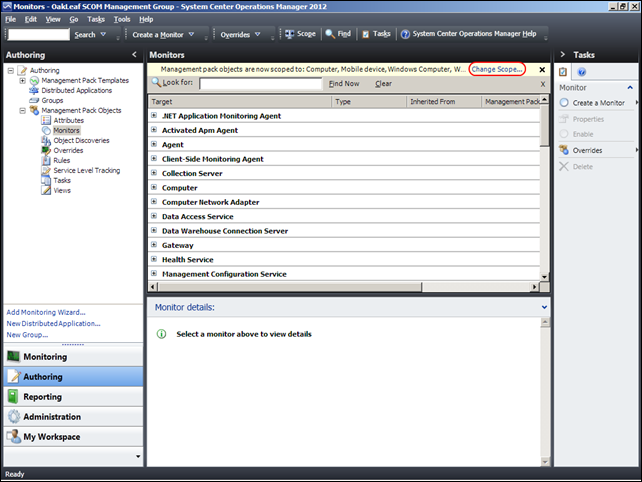
1. Click the Authoring button in the left pane and select the Authoring \ Management Pack Objects \ Monitors node to display the Monitors list:
2. If you type Azure in the Monitor list’s text box and click Find Now, you won’t see any Windows Azure monitors. The same is true if you scroll to the end of the Monitors list.
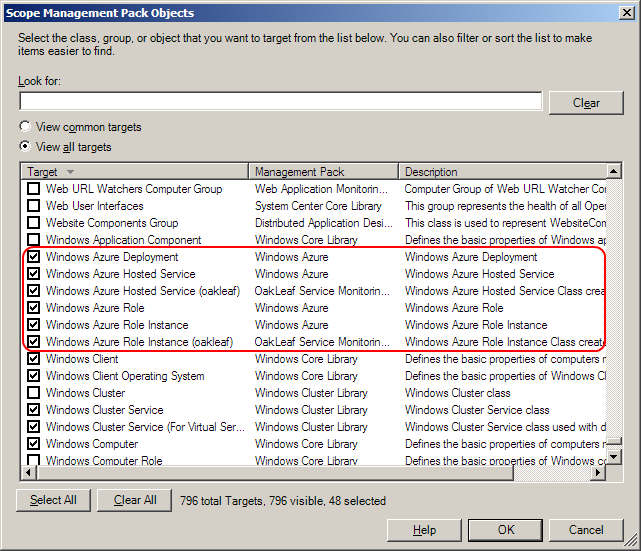
3. To make the Windows Azure monitors visible, click the Change Scope link at the upper right of the Monitors list to open the Scope Management Pack Objects, select the View All Targets option and scroll to near the bottom of the list to expose the six Windows Azure … objects added by installing the Monitor Pack. Mark the six check boxes:
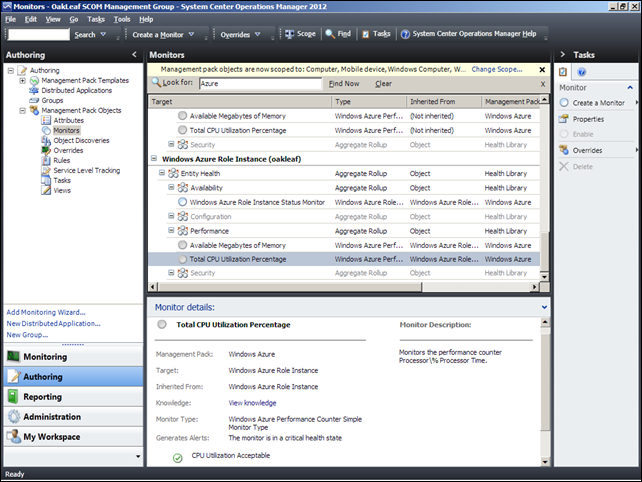
4. Click OK to return to the Authoring window, type Azure in the Look For text box, and click Find Now to display an expanded list of the Windows Azure targets:
Changing the Enabled by Default value from False to True with an Override
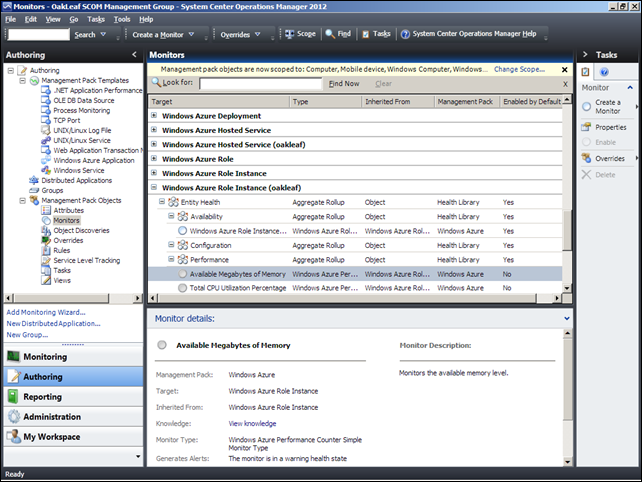
1. With Authoring activated, scroll to the Windows Azure monitoring groups you marked in the preceding section, expand Windows Azure Role Instance (ServiceName) item and its Availability and Performance nodes, and select the Available Megabytes of Memory monitor to display its details in the lower pane:
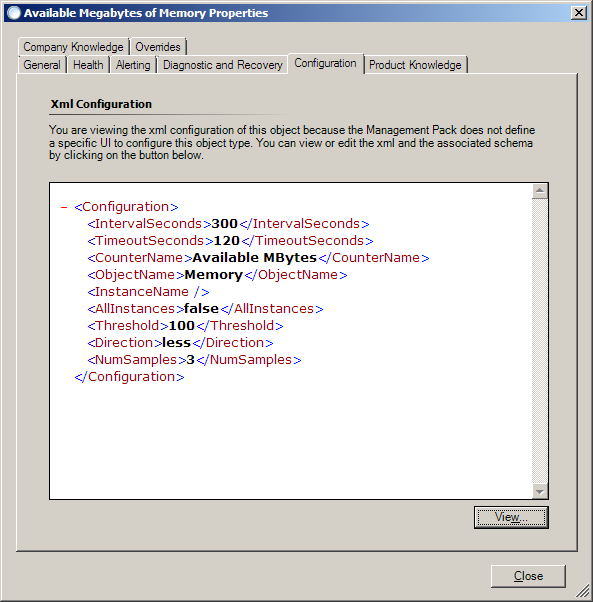
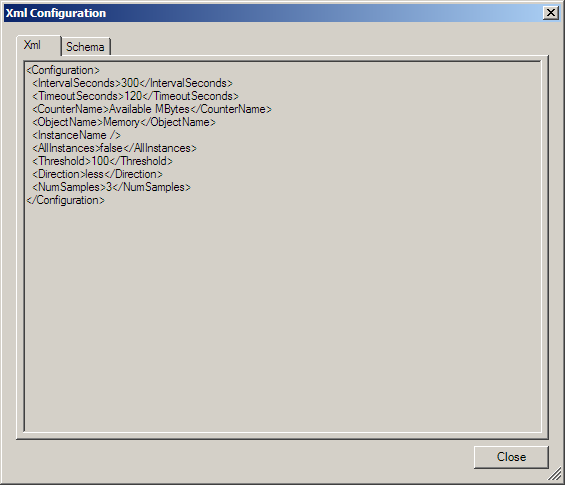
2. Double-click the Available Megabytes of Memory item to open the Available Megabytes of Memory Properties sheet. Click the Configuration tab to display the XML document that configures the monitor:
3. The default value of less than 100 MB for three samples at five-minute intervals probably will be satisfactory. If you want to edit the XML document, click View to open an editable text box:
4. Make your changes (except to the CounterName value) and click close to return to the properties sheet.
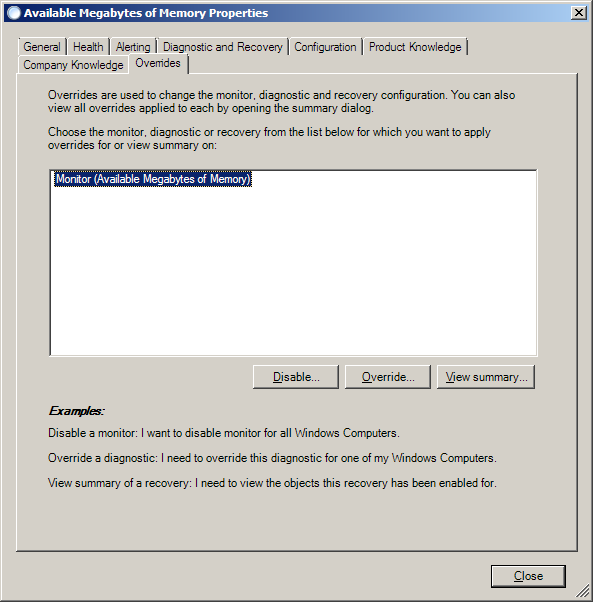
5. Click the Overrides tab to display a list of the monitors that can be overridden in this operation, one in this case:
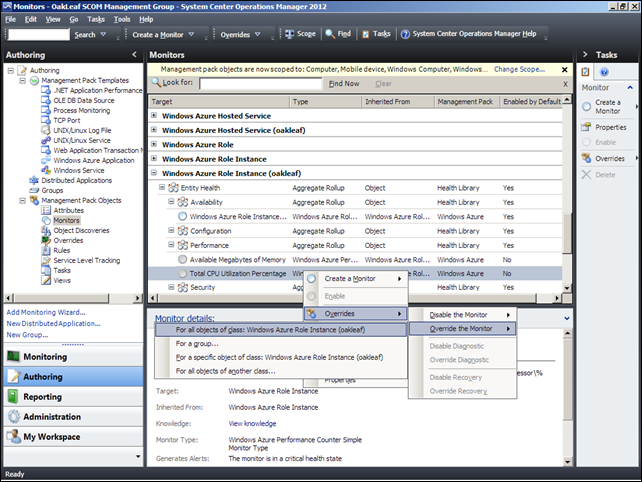
6. Click the Override button to open the context menu and choose the first option, which applies the override to all Role Instances in your hosted service:
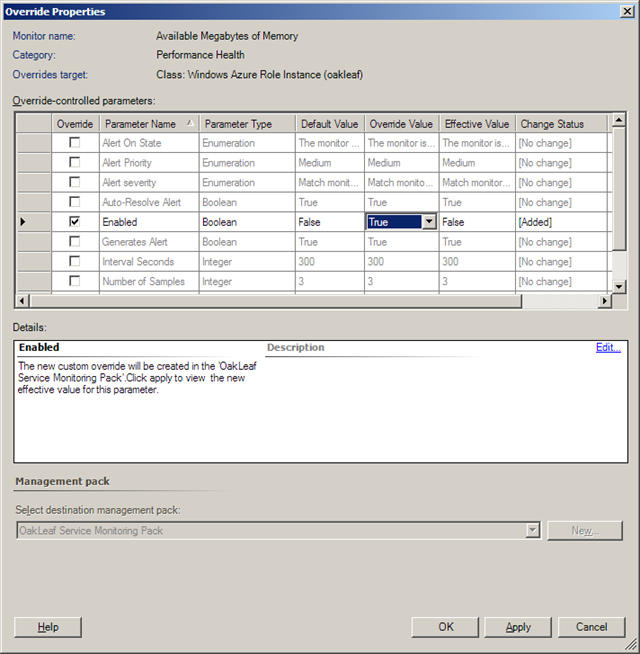
7. The Enabled parameter is selected by default in the Override Properties dialog. Mark the checkbox and select True from the list in the Override Value dialog:
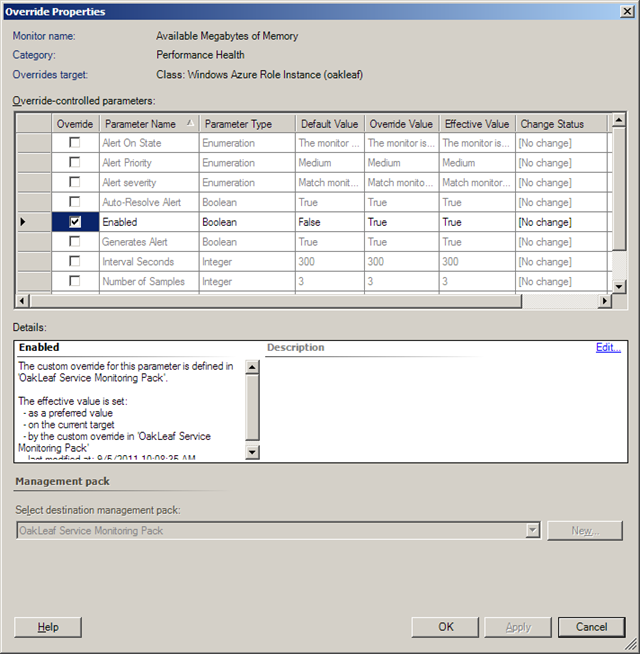
8. The Effective Value doesn’t change from False to True until you click the Apply button:
9. Click OK twice to close the Override and Available Megabytes of Memory Properties sheet, which doesn’t acknowledge the change, even if you press F5.
10. Right-click the Total CPU Percentage item and choose Overrides, Override the Monitor, For All objects of Class to open the Overrides Properties dialog.
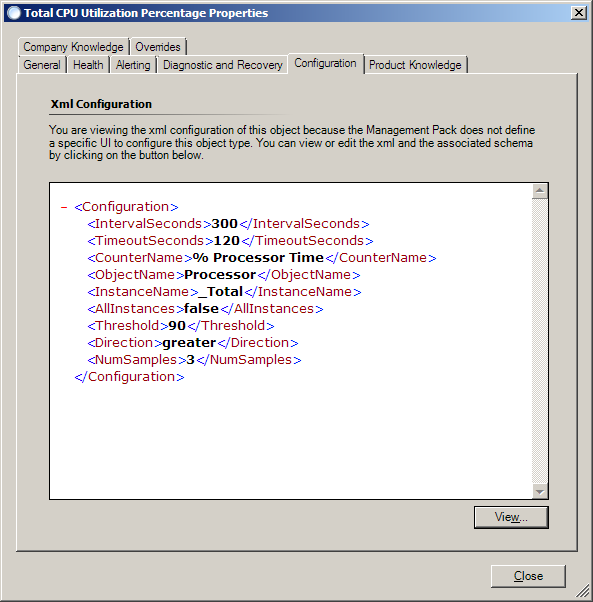
11. Click the Configuration tab to confirm the threshold for an alert, > 90% CPU utilization:
12. Repeat steps 7 through 9.
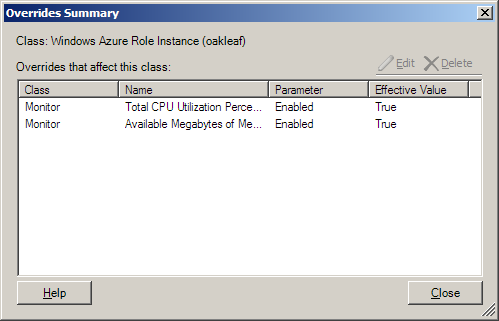
13. Click the Overrides task in the right pane, choose Summary and For All Objects of Class to open the Overrides Summary dialog, which displays the correct Effective Values:
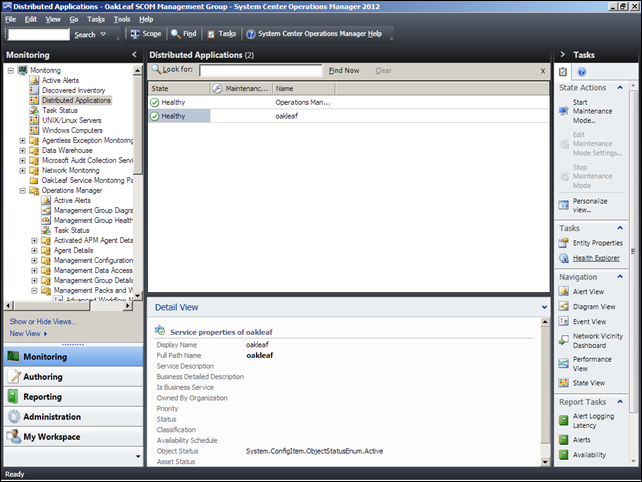
14. Click Close and select the Monitoring \ Distributed Applications to open the Distributed Applications list and select the ServerName item (oakleaf for this example):
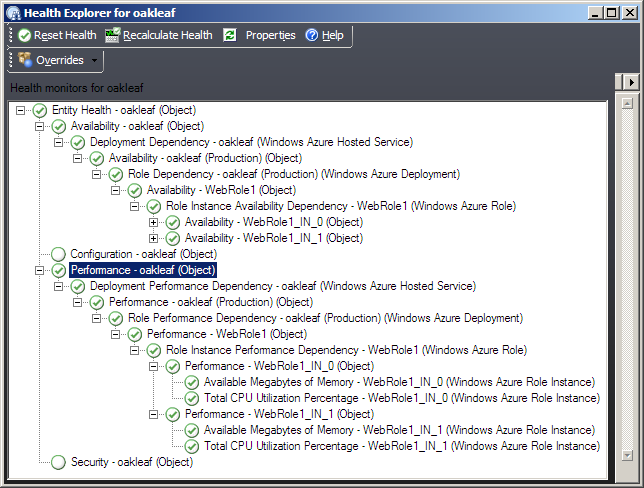
15. Click the Health Explorer button in the Tasks section of the Tasks pane to open the Health Explorer dialog’s diagram. Expand the Availability and Performance nodes:
16. Observe that all performance nodes are checked, unlike the diagram that appeared when you installed the WAzMP in which all Performance – oakleaf (Object) node icons were empty. (See the screen capture in step 57, near the end of the Installing the Systems Center Monitoring Pack for Windows Azure Applications on SCOM 2012 Beta post of 9/4/2011.)
Enabling Windows Azure Diagnostics Data Storage Grooming
The WZaMP documentation states in the “Grooming Data from Windows Azure Storage Services” section:
Windows Azure Diagnostics writes performance and event information to Azure Storage, but does not delete it. This means that the tables in the Windows Azure storage account will continue to grow unless the data is groomed.
The Monitoring Pack for Windows Azure Applications provides three rules that control data grooming:
- Windows Azure Role NT Event Log Grooming
- Windows Azure Role Performance Counter Grooming
- Windows Azure Role .NET Trace Grooming
By default, these grooming rules are disabled. If you want Operations Manager to periodically groom data from Windows Azure Storage Services, use overrides to enable the rules. By default, the enabled rules run every 24 hours.
You can use the event log on the root management server to track data grooming. Event 34023 is logged when grooming starts. Event 34014 is logged when grooming is completed, and the event includes the count of deleted rows and the time when grooming occurred.
Unfortunately, the documentation doesn’t explain how to “use overrides to enable the rules.”
1. Click the Authoring button and select the Authoring \ Management Pack Objects \ Rules node to display the Rule list.
2. Type Azure in the Look For text box and click Find Now to display the prebuilt rules for Windows Azure objects. (It’s not necessary to click Change Scope and select the View All Objects in this case.)
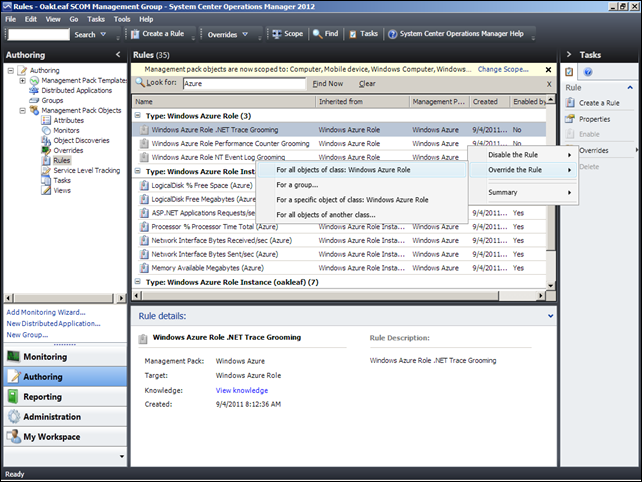
3. Scroll to the Type: Windows Azure Role object, which has three instances, select Windows Azure Role .NET Trace Grooming, click the Overrides button in the Tasks pane, and select Override the Rule and For All Objects of Class:
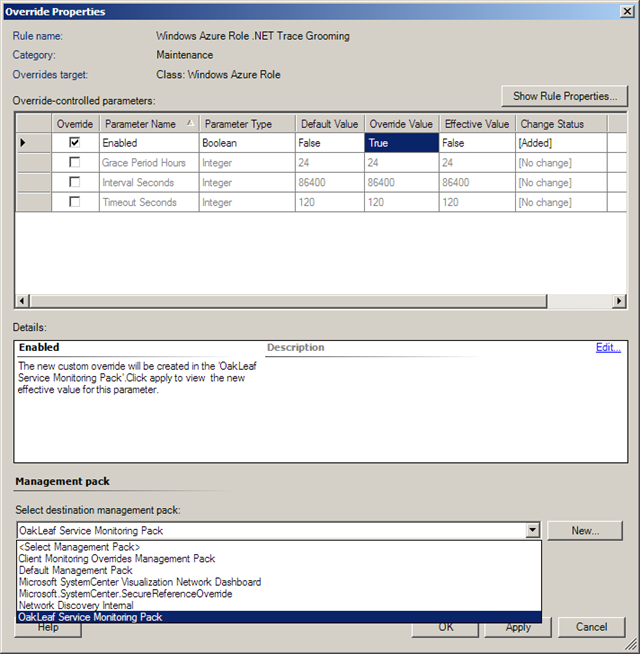
4. In the Override Properties dialog, mark the Enabled check box, select True form the Override Value list, and select the name of your new monitoring pack from the Management Pack list, OakLeaf Service Monitoring Pack for this example:
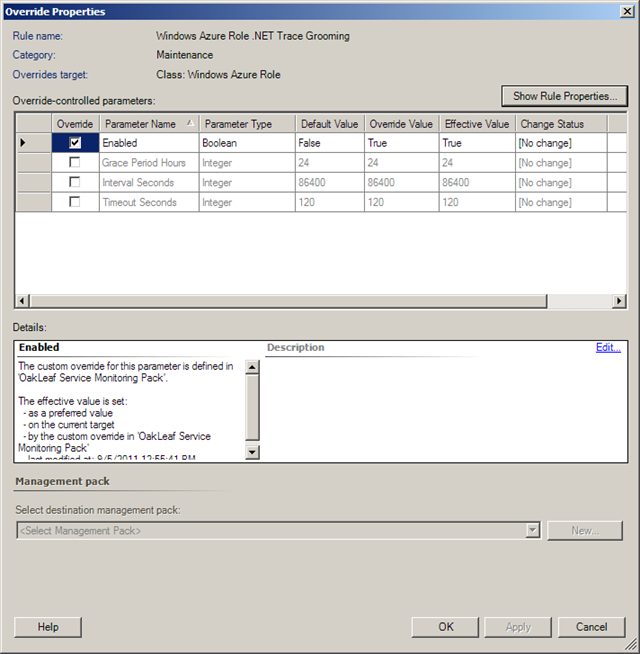
5. Click Apply to validate the change. (Also notice the change of the text in the Details text box):
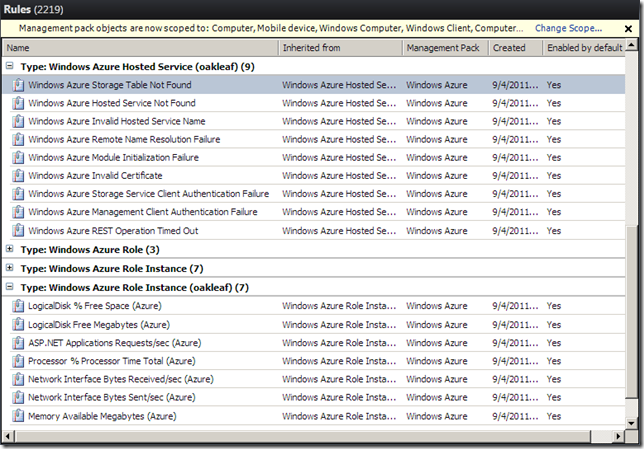
6. Repeat steps 3 through 5 for the Windows Azure Role Performance Counter Grooming and Windows Azure Role NT Event Log Grooming rules. Following are some of the additional WindowAzure rules for the oakleaf Hosted Service and its two role instances.
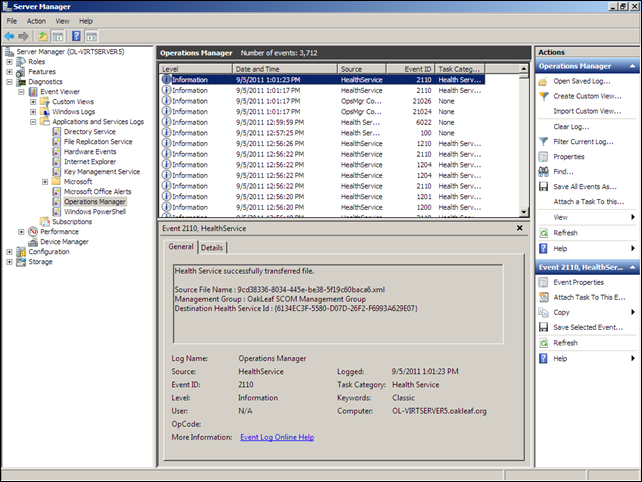
7. Periodically open Server Manager, select the Server Manager \ Diagnostics \ Event Viewer \ Applications and Services Logs \ Microsoft \ Operations Manager to open the Operations Manger event list, and look for Event 34023 (when grooming starts) and Event 34014 (when Grooming finishes and reports the count of deleted rows.)
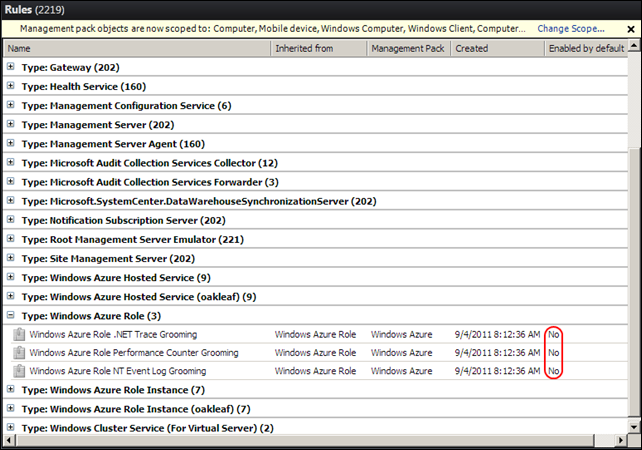
8. As was the case for the counters, applying the overrides doesn’t change the Enabled by Default setting in the Rules list.
• Updated 9/6/2011 8:00 AM PDT, about 20 hours after the preceding configuration changes.
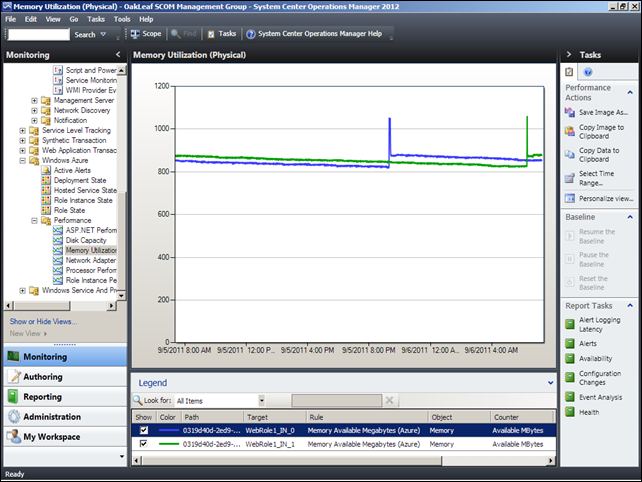
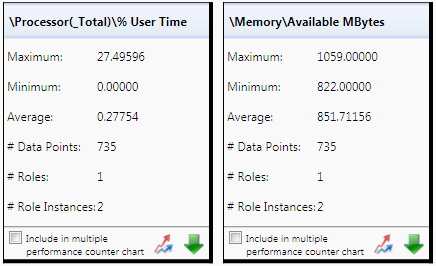
1. Memory Utilization (Physical) data as Memory Available Megabytes is being collected for both instances as expected:
There appears to be a memory leak in the two instances.
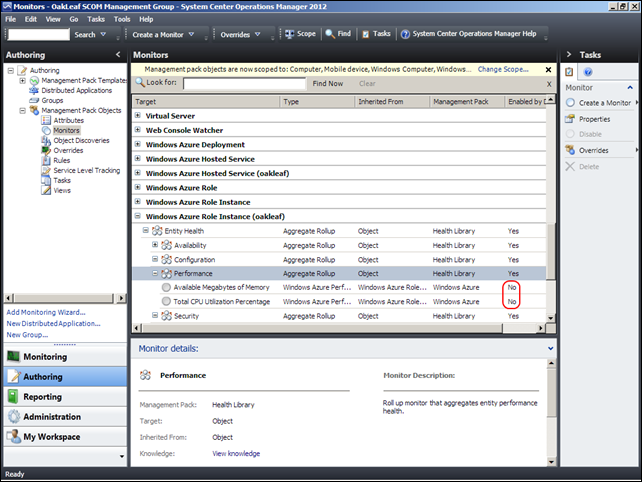
2. Processor Peformance (Total CPU Utilization Percentage) is not being collected. No counter appeared when I opened the Processor Performance chart. Both Performance counters still display No for Enabled by Default:
3. Following is the counter information for the past 8 hours from Cerebrata’s Azure Diagnostics Manager:
Action: I have reported failure to enable the Total CPU Utilization Percentage counter by default and the erroneous indication of Available Megabytes of Memory as not enabled by default to Microsoft Connect as bugs in this Bug Feedback item. I’ve also suggested that these two counters be enabled by default in this Suggestion item. I’ll wait until tomorrow for the verdict on data storage grooming.



3 comments:
Roger - I am not sure if you saw my reply to your comment on http://blogs.technet.com/b/momteam/archive/2011/08/12/application-performance-monitoring-in-opsmgr-2012-beta.aspx
There are multiple reasons for not enabling those rules by default - the most important of which is that the customer gets billed for IO and storage transactions, and we want them to consciously enable this being aware of it - not find out later when they get a higher bill.
Another reason is that it is not guaranteed that the customer actually has those counters enabled and collected in table storage.
Another couple of points would be that the UI behaviour (=not showing "enabled" after having enabled thru overrides) is by design in OM - only the default value is shown in the grid; the overridden value is shown in the "overrides" view, in the "overrides" report, among other places.
One last note is about the diagram/architecture you took from our blog - that diagram depicts the APM feature in OpsMgr 2012 - at the time of writing that is just for on-premise monitoring of IIS machines that have the OpsMgr agent installed.
The current Azure MP works diferently, not deploying an agent on the Azure VMs, but using the WAD tables as well as the Azure management API.
Hope that helps.
Daniele,
Thanks for the clarification.
You are welcome. Thanks for the very good step-by-step tutorial!
Post a Comment